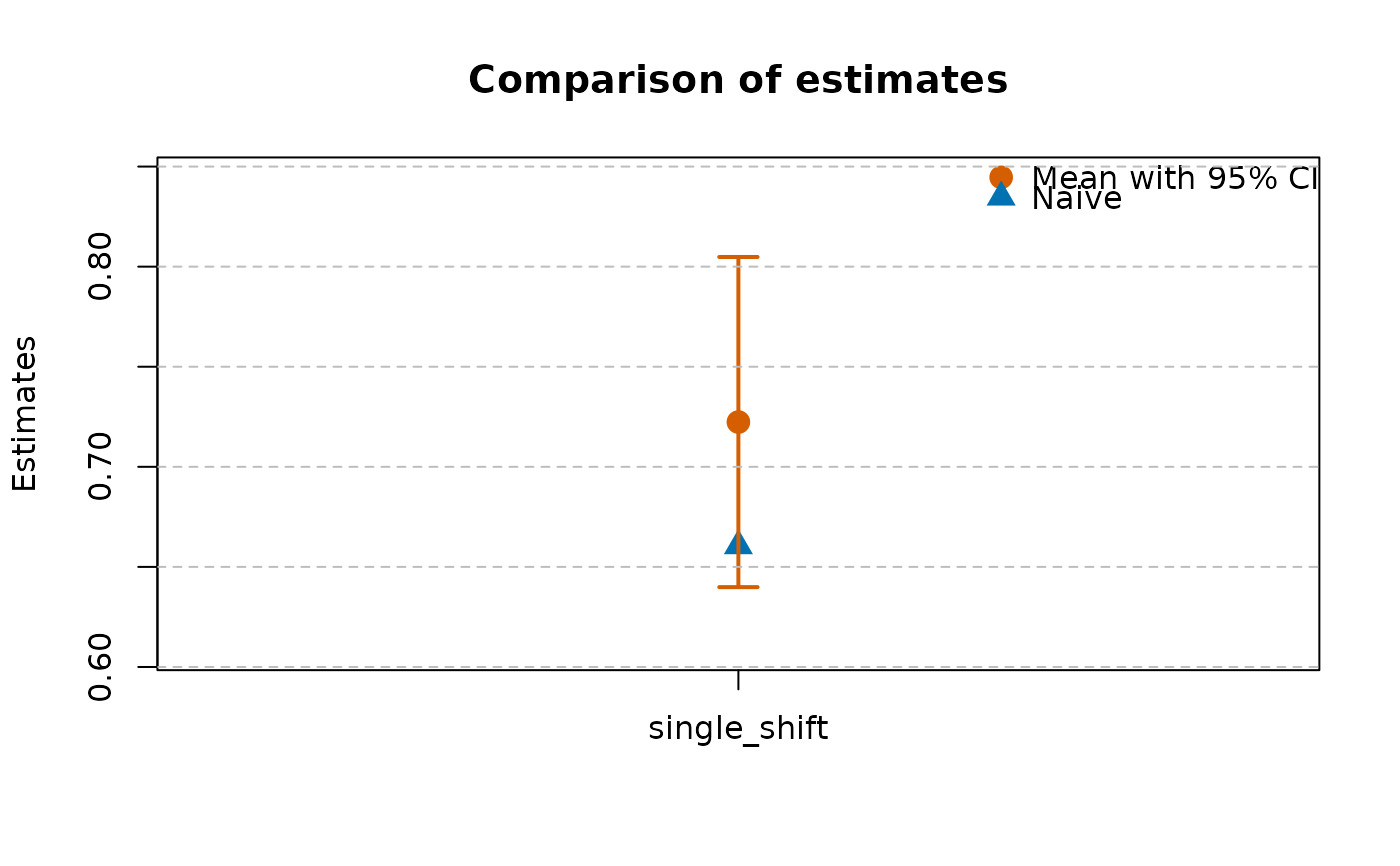
Simple plotting method that compares the estimated mean(s) and CI(s) with the naive (uncorrected) estimates.
Usage
# S3 method for class 'nonprob'
plot(x, ...)Simple plotting method that compares the estimated mean(s) and CI(s) with the naive (uncorrected) estimates.
# S3 method for class 'nonprob'
plot(x, ...)